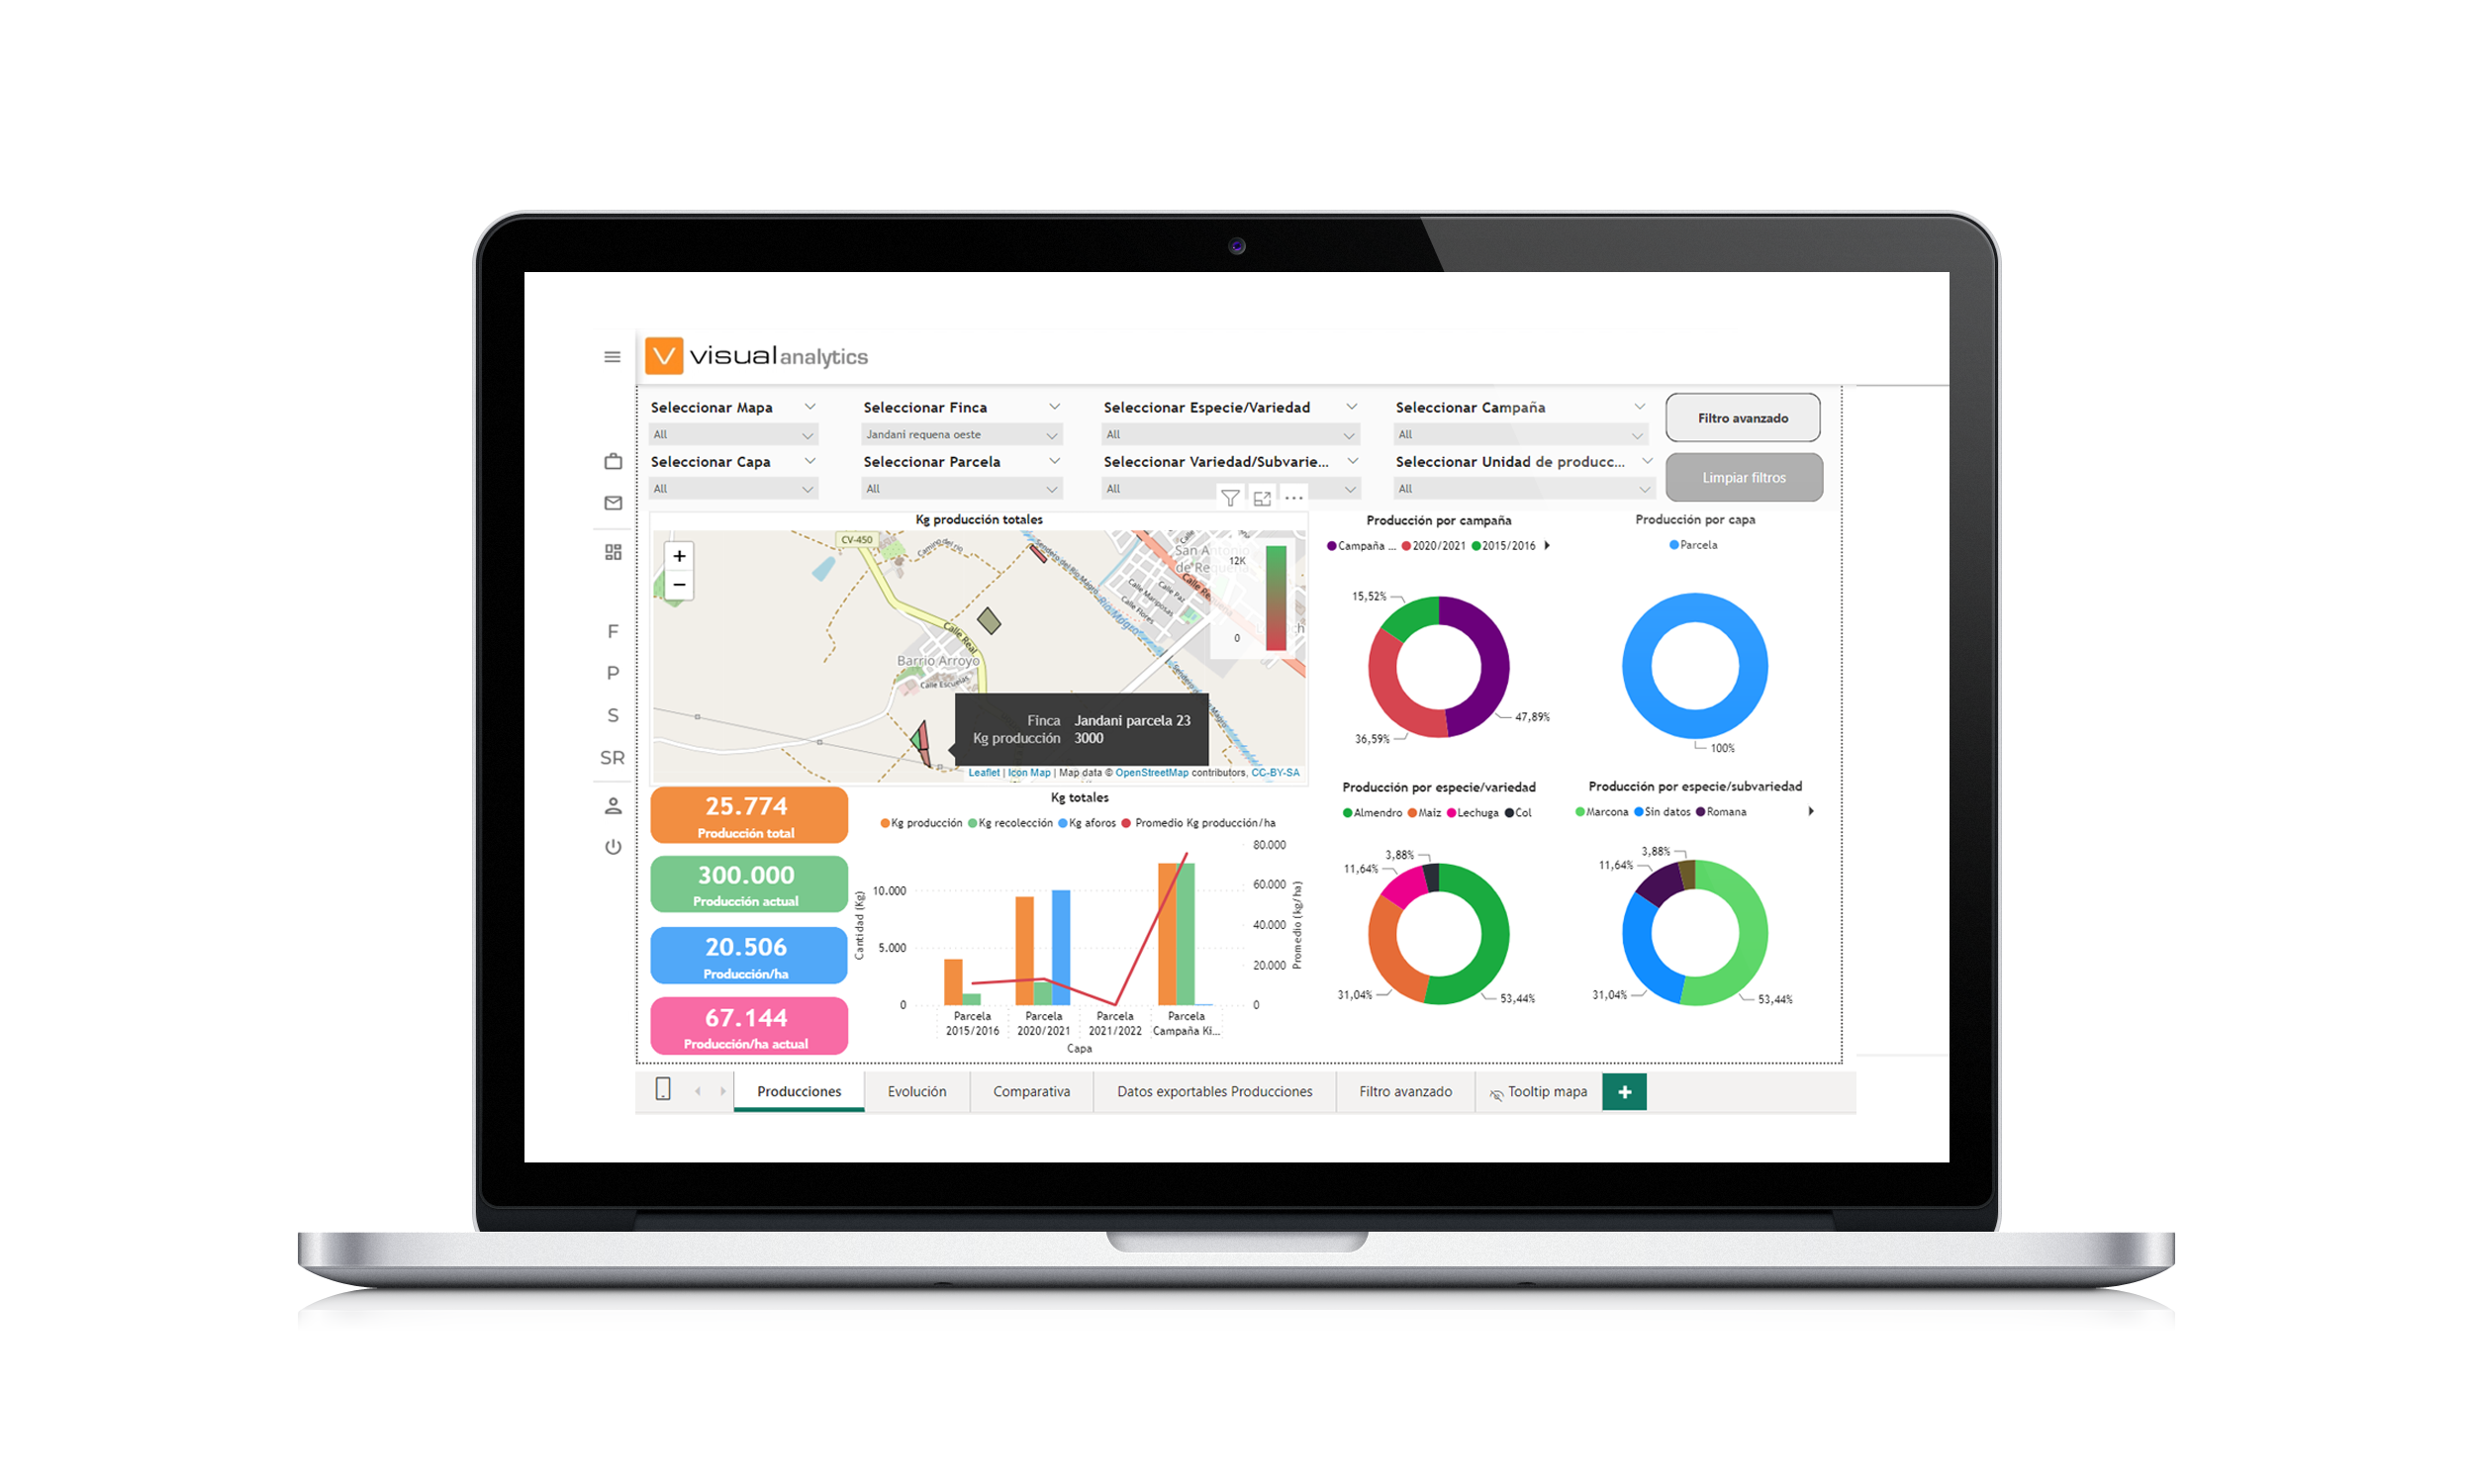
We know that it’s not just about having the data; you need to know how to interpret it. Visual Analytics is our solution to achieve this. We gather, analyze, and visualize data in an easy-to-understand way.
As experts in data lifecycle management, we extract data from the Visual platform, standardize it, and refine it, identifying any anomalies. Then, we use this data to perform in-depth analysis. As a result, our reports are more detailed, comprehensive, and up-to-date. Furthermore, we have improved and updated our graphics to make them as clear and intuitive as possible, ensuring that information is easily understood.

Continuous Updates

Historical Data

Detailed, Concise, and Clear Reports

Decision Support
Advantages of Visual Analytics
[/ld_section_title][ld_section_title title=”” title_top_margin=”10″ title_bottom_margin=”10″ subtitle_top_margin=”11″ subtitle_bottom_margin=”10″ text_top_margin=”0″ text_bottom_margin=”0″ use_custom_fonts_subtitle=”true” subtitle=”Having information is sometimes not enough; you need to know how to interpret it. Our tool helps you do this easily so you can benefit from all these advantages:” sub_color=”rgb(34, 45, 91)” css=”.vc_custom_1698322285254{margin-top: -10px !important;}”][/ld_section_title]

Cost reduction
You can identify areas where cost reduction is possible, leading to increased profitability.

Identifying trends and anomalies
By visualizing data in a simple way, you can identify patterns and anomalies that may arise.
Crop management
Monitoring crop production and harvest quality to make informed decisions.

Pesticide and fertilizer control
Compliance with regulations
Data helps us verify compliance with objectives for reducing the use of fertilizers and pesticides within the framework of the EU’s new 2030 biodiversity strategy and the Green Deal.
Tracking crop performance
Identifying factors that can affect crop performance, such as weather conditions or agricultural practices.

Inventory control
Maintaining accurate records of agricultural products, supplies, and equipment.
Agricultural machinery tracking
Managing this data minimizes downtime and optimizes productivity.
Financial performance monitoring
Tracking operational costs, income, and profit margins, enabling more informed financial decisions.

Enhanced control and safety
Continuous updates provide greater control over personnel tasks, expenses, machinery, supplies, and more. Only when you have control over things can you be confident in doing them right.

Quality control and food safety
Assisting in the management of agricultural product quality and compliance with food safety regulations by providing tools for data tracking and visualization.
Sustainable farming
With all the information at your disposal, you can optimize resources such as water, fertilizers, pesticides, and cultivate sustainably.
If you’re interested, please get in touch with us. We’ll inform you about everything you can achieve with Visual Analytics
[/ld_section_title][ld_button style=”btn-solid” title=”I’M INTERESTED” shape=”round” size=”btn-custom” link=”url:https%3A%2F%2Fcopiavisual.multisite.visualnacert.com%2Fcontacto-en-ingles%2F|title:VISUAL%20App%20agr%C3%ADcola%20%7C%20Toda%20la%20potencia%20de%20Visual%20en%20tu%20mano” fs=”15px” ls=”0.02em” hover_color=”rgb(198, 100, 23)” custom_size=”250px” custom_height=”30px” css=”.vc_custom_1698324746542{margin-bottom: 40px !important;}”]
Types of Reports
[/ld_section_title][ld_section_title title=”” title_top_margin=”10″ title_bottom_margin=”10″ subtitle_top_margin=”11″ subtitle_bottom_margin=”10″ text_top_margin=”0″ text_bottom_margin=”0″ use_custom_fonts_subtitle=”true” subtitle=”When information is clear, so is decision-making.” sub_color=”rgb(34, 45, 91)” css=”.vc_custom_1698323459894{margin-top: -40px !important;}”][/ld_section_title]

Labor cost breakdown
- Labor costs
- Machinery costs
- Supply costs
- Cost evolution by season
- Comparison between agricultural fields
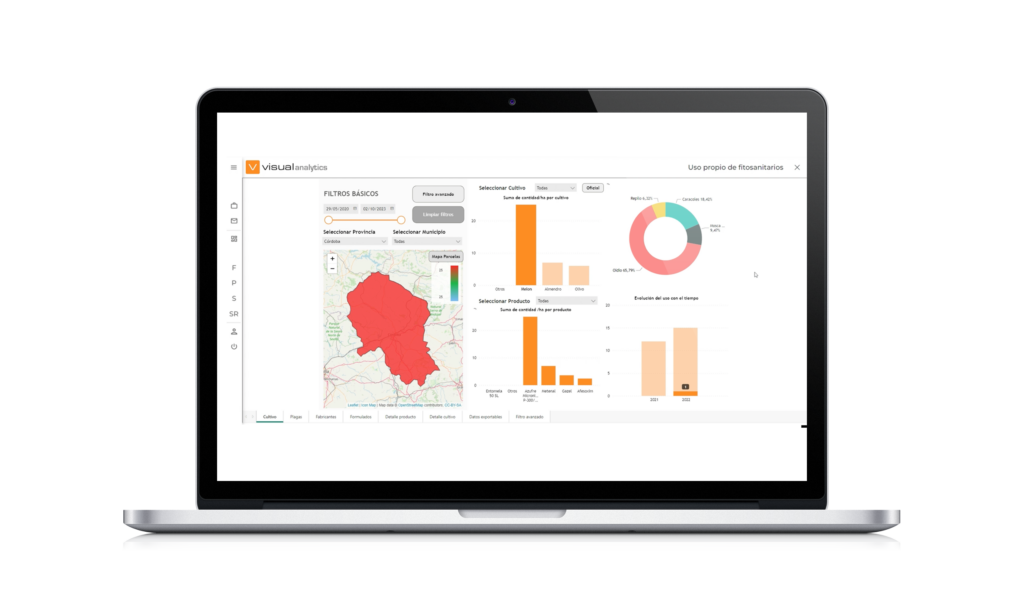
Phytosanitary usage
- Distribution by layer, crop, pest, formulation, and manufacturer
- Usage evolution by year
- Dose used evolution by year
- Hectare-based usage reduction goal
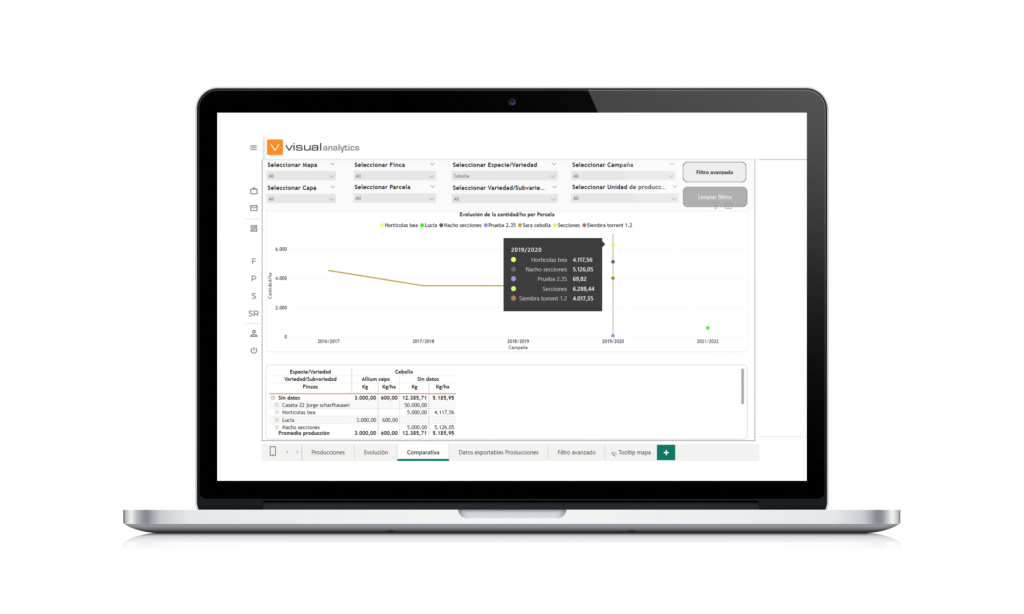
Production and harvests
- Distribution by season, layers, or varieties
- Production evolution by season
- Comparison between agricultural fields
Agricultural remote sensing, API VISUAL connectivity, agroclimatic information … Regardless of the solution you choose, discover the common services to all VISUAL solutions.
Have all the information at your finger-tips everywhere. Visual App allows you to consult and to register all the activities in all the places independently if you have connection or not. It allows you to synchronise all the information introduced when you have internet access will be available in the cloud for all the devices.
[/ld_fancy_heading][ld_button style=”btn-solid” title=”Visual APP” shape=”semi-round” size=”btn-sm” link=”url:https%3A%2F%2Fcopiavisual.multisite.visualnacert.com%2Fvisual-app-agricola-toda-la-potencia-de-visual-en-tu-mano-en-ingles%2F|title:VISUAL%20App%20agr%C3%ADcola%20%7C%20Toda%20la%20potencia%20de%20Visual%20en%20tu%20mano” fs=”15px” ls=”0.02em” css=”.vc_custom_1698324097866{margin-right: 8px !important;margin-bottom: 10px !important;padding-right: 0.75em !important;padding-left: 0.75em !important;}” hover_color=”rgb(39, 39, 39)”][ld_spacer]